
Visualizing Financial Statements of Your Favorite Companies with Plotly Sankey Diagrams
Never Forget What’s Inside the Numbers Again

👉 GET THE PYTHON NOTEBOOK for the full analysis in this post here.👉 Try out the accompanying Streamlit app that I have deployed here.Financial statements are packed with insights, but unless you have studied hundreds of them, you may find that they are hard to internalize.
Ever found yourself staring at a company’s balance sheet or income statement…
then forgetting how all the line items connect just minutes later?
We memorize terms like Current and Non-Current Assets and Liabilities, Stockholders’ Equity, Retained Earnings, Accrued Expenses etc. but over time, the breakdown of these numbers and how they connect to one another may just fade from memory. This is where Sankey diagrams come in.
Sankey Diagrams
Sankey diagrams are flow charts which help show how the line items within a financial statement connect and contribute to the bigger picture.
I find them incredibly effective for “looking under the hood” of financial statements and I used the Plotly library in Python to generate them. Below are some examples (click to enlarge).
First, let’s look at the balance sheet.
Balance Sheet
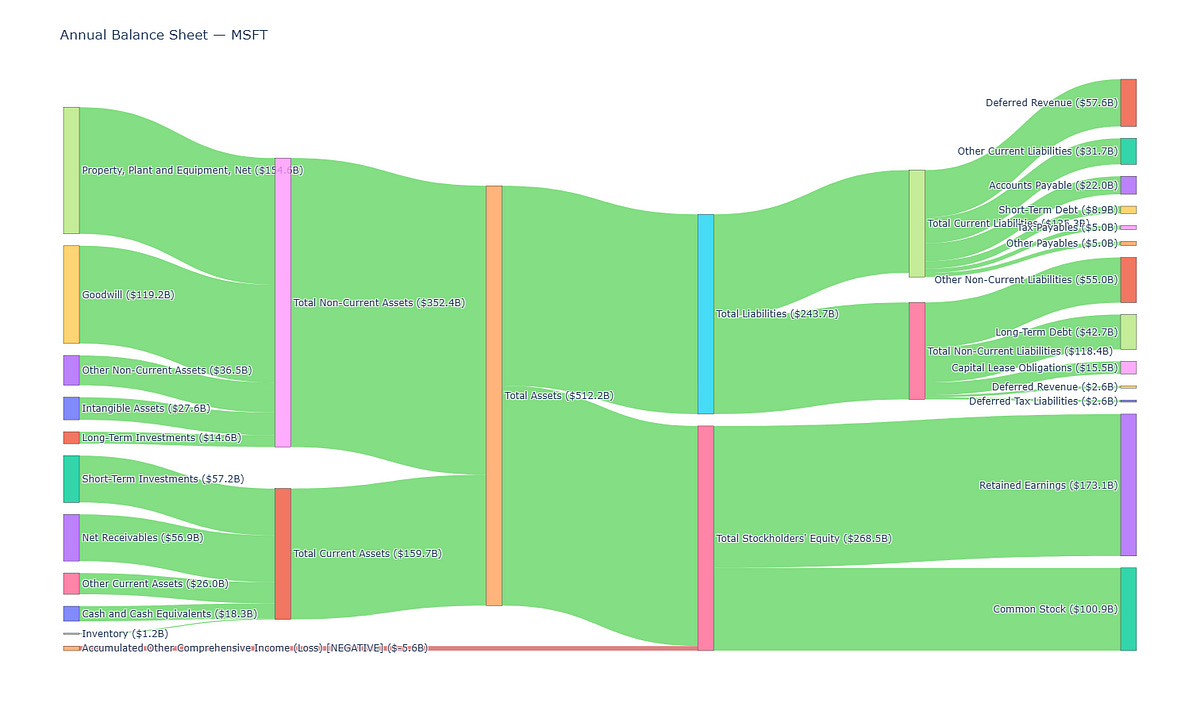
One look and you can easily tell the following:
How the Assets (in the middle) are split into Non-Current and Current Assets (on its left)
The respective constituents of the Non-Current and Current Assets (further out on the left)
How the Assets are funded by the Liabilities and Equity (on its right)
The funding structure of a company, whether it is funded more excessively by its Liabilities or Equity, or if there is an equal split (because the thickness of the links are proportional to the dollar values)
and more…
Let’s move on to the Income Statement.
Income Statement
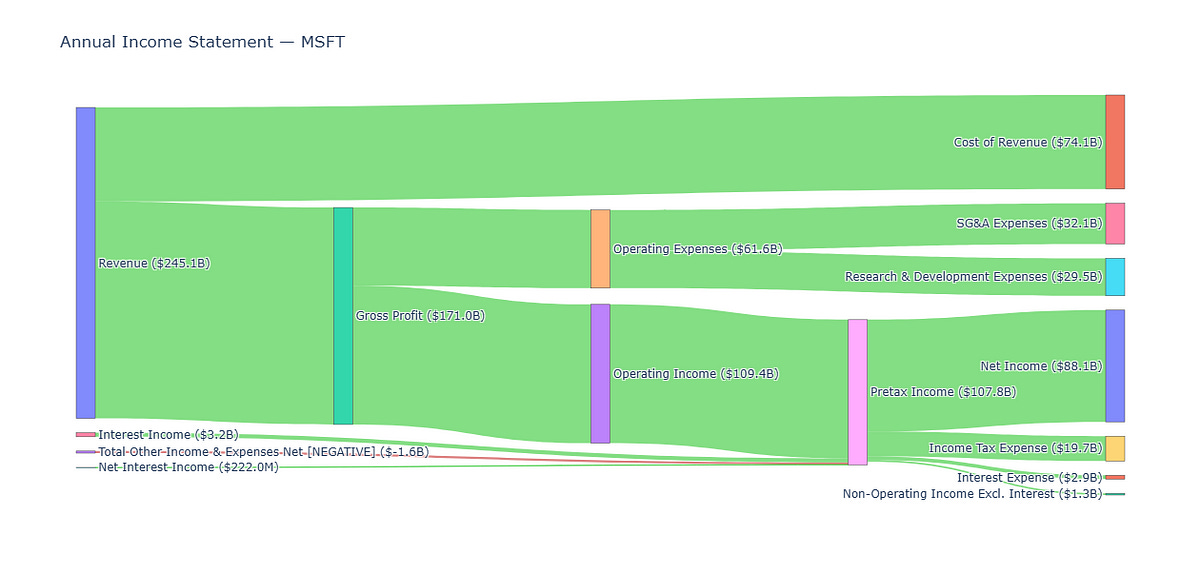
Similarly we can easily tell:
How Revenue splits into Cost of Revenue and Gross Profit
How Operating Expenses eats into Gross Profit
How Operating Income gets chipped away by Interest and Taxes
and more…
Let’s move on to the Cash Flow Statement.
Cash Flow Statement
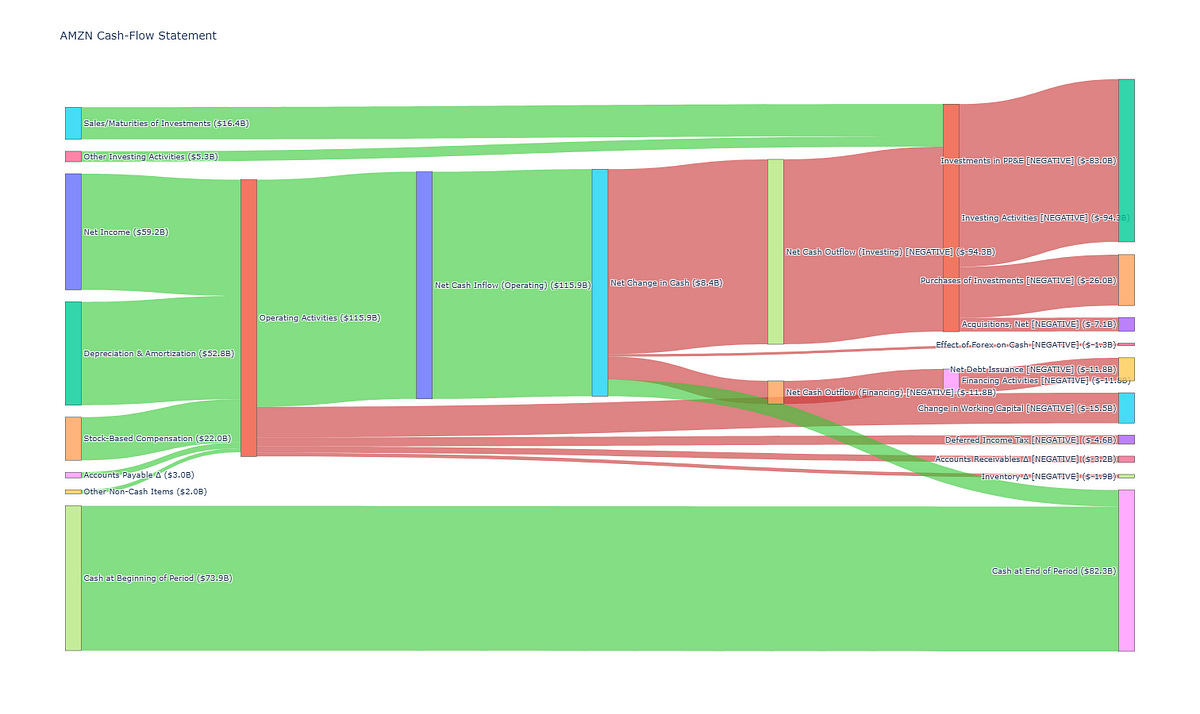
Here we can see:
All the cash inflows from Operating Activities and its constituents flowing from the left to the middle
All the cash outflows from the middle to the right, broken into Financing and Investing Activities
The Net Change In Cash (in the middle) due to the inflows and outflows, and how it adds to the Cash at Beginning of Period to result in the Cash at End of Period.
and more…
Now that we see the usefulness of these diagrams, let’s look at how to plot these in Python.
Imports
We only need a few imports for this, mainly to obtain and process the financial data before visualizing it.
import requests
import pandas as pd
import plotly.graph_objects as go # pip install plotly
import os
Obtain Financial Statements from FMP API
The company Annual Financial Statements can be obtained from the Financial Modeling Prep API for free. You need to sign up for an account here to get an API key (250 requests per day for the free tier).
Enter your API key in the following code to store it in the environment variable “FMP_API_KEY”. We will use this for our requests later.
# uncomment and enter your FMP API Key inside
# os.environ['FMP_API_KEY'] = "YOUR_FMP_API_KEY"
apikey = os.environ['FMP_API_KEY']
Balance Sheet
The past 5 years of balance sheet data is returned by the FMP API in JSON (details of API endpoint here). Here we obtain the balance sheet of AMZN and parse the JSON into a Pandas DataFrame. Feel free to change the ticker symbol to any company of your interest.
symbol = "AMZN"
statement = "balance-sheet-statement"
url = f"https://financialmodelingprep.com/stable/{statement}?symbol={symbol}&apikey={apikey}"

# parse json from FMP API and load into dataframe
def parse_json(url):
    resp = requests.get(url)
    resp.raise_for_status()
    data = resp.json()
    df = pd.DataFrame(data)
    return df

df_balance_sheet = parse_json(url)
df_balance_sheet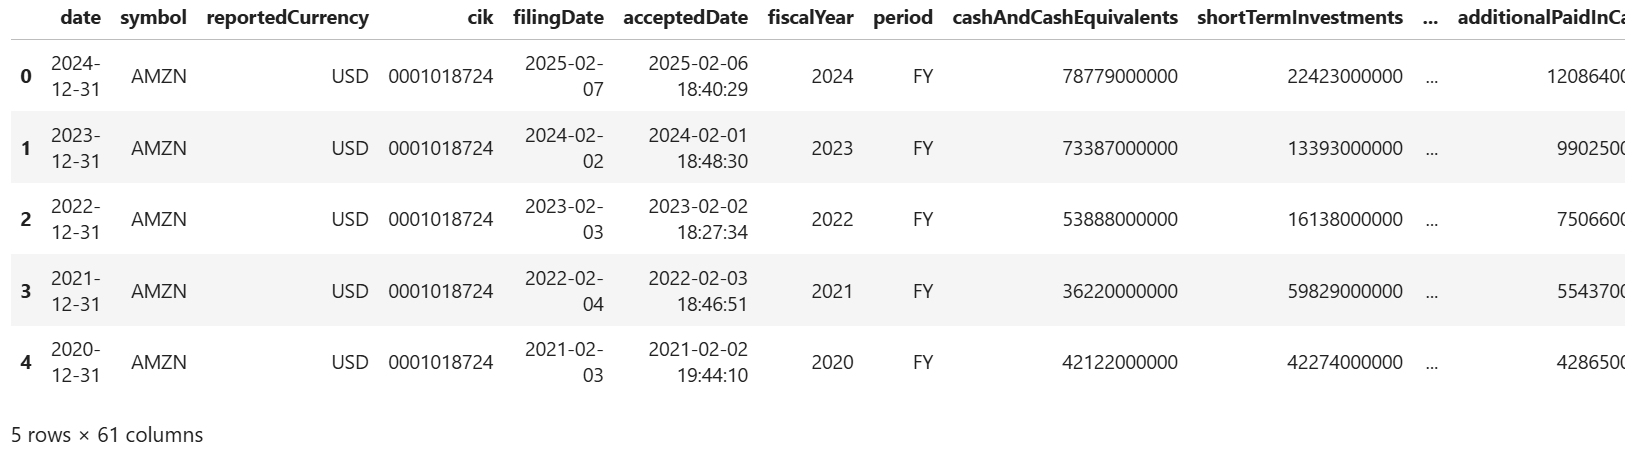
As shown above, the latest period’s (end of last year) statement is on the first row so let’s slice it out into a Pandas Series.
# pick the latest period (i.e. first row)
balance_sheet = df_balance_sheet.iloc[0]
balance_sheet
Income Statement
Let’s do the same for the income statement (details of API endpoint here).
statement = "income-statement"
url = f"https://financialmodelingprep.com/stable/{statement}?symbol={symbol}&apikey={apikey}"

# parse json from FMP API and load into dataframe
df_income_statement = parse_json(url)

df_income_statement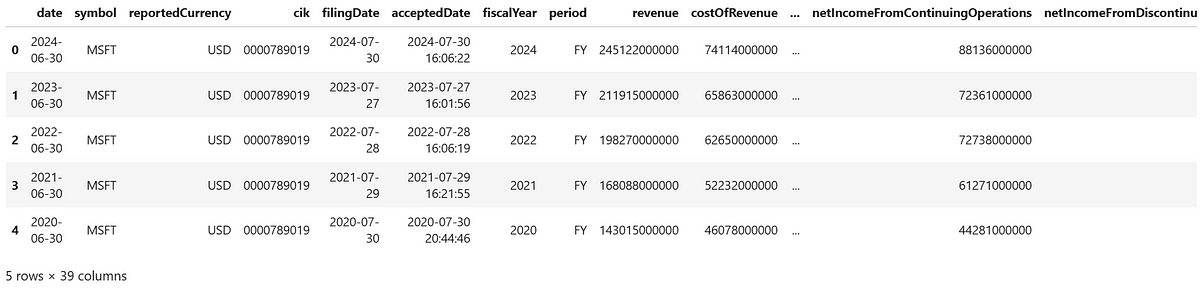
# pick the latest period (i.e. first row)
income_statement = df_income_statement.iloc[0]
income_statement
Cash Flow Statement
Let’s do the same for the income statement (details of API endpoint here).
statement = "cash-flow-statement"
url = f"https://financialmodelingprep.com/stable/{statement}?symbol={symbol}&apikey={apikey}"

df_cash_flow = parse_json(url)
df_cash_flow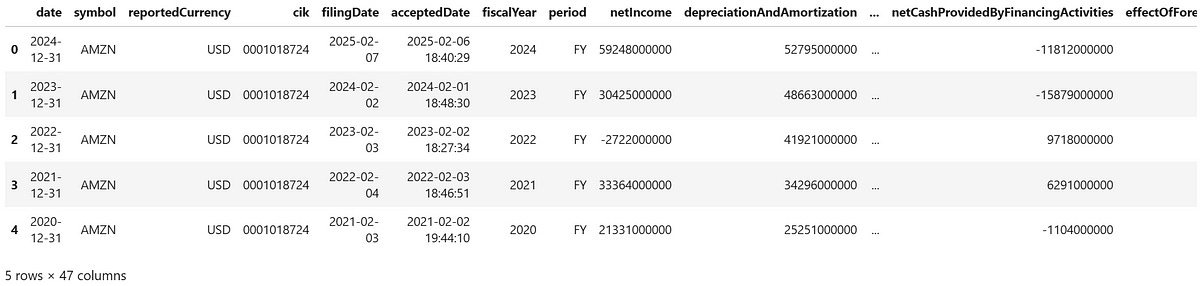
# pick the latest period (i.e. first row)
cash_flow = df_cash_flow.iloc[0]
cash_flow
We now have the required data for our Sankey diagram!
Balance Sheet Visualization
Define the Source and Target Flows
First, we define the source and target flows for the Sankey diagram of the balance sheet of AMZN. We break the Current Assets, Non-Current Assets, Total Assets, Current Liabilities, Non-Current Liabilities and Equity into their underlying components.
Each flow moves from left to right, and the width of each connection is proportional to the dollar amount it represents. For example, in the line:
("Cash and Cash Equivalents", "Total Current Assets", balance_sheet["cashAndCashEquivalents"])“Cash and Cash Equivalents” flows into “Total Current Assets” and its width reflects the actual amount returned by the API for cashAndCashEquivalents.
We store all the flows into a list, which we will process later before passing the values to render the Sankey diagram.
# define all Sankey flows (left is source, right is target)
flows = [
    # Current Assets
    ("Cash and Cash Equivalents",            "Total Current Assets",            balance_sheet["cashAndCashEquivalents"]),
    ("Short-Term Investments",               "Total Current Assets",            balance_sheet["shortTermInvestments"]),
    ("Net Receivables",                      "Total Current Assets",            balance_sheet["netReceivables"]),
    ("Inventory",                            "Total Current Assets",            balance_sheet["inventory"]),
    ("Prepaids",                             "Total Current Assets",            balance_sheet["prepaids"]),
    # NOTE: Other Current Assets may sometimes overlap with some of the above lines
    ("Other Current Assets",                 "Total Current Assets",            balance_sheet["otherCurrentAssets"]),

    # Non-Current Assets
    ("Property, Plant and Equipment, Net",   "Total Non-Current Assets",        balance_sheet["propertyPlantEquipmentNet"]),
    ("Goodwill",                             "Total Non-Current Assets",        balance_sheet["goodwill"]),
    ("Intangible Assets",                    "Total Non-Current Assets",        balance_sheet["intangibleAssets"]),
    ("Long-Term Investments",                "Total Non-Current Assets",        balance_sheet["longTermInvestments"]),
    ("Tax Assets",                           "Total Non-Current Assets",        balance_sheet["taxAssets"]),
    ("Other Non-Current Assets",             "Total Non-Current Assets",        balance_sheet["otherNonCurrentAssets"]),

    # ... to Total Assets
    ("Total Current Assets",                 "Total Assets",                    balance_sheet["totalCurrentAssets"]),
    ("Total Non-Current Assets",             "Total Assets",                    balance_sheet["totalNonCurrentAssets"]),

    # Total Assets to ...
    ("Total Assets",                         "Total Liabilities",               balance_sheet["totalLiabilities"]),
    ("Total Assets",                         "Total Stockholders' Equity",      balance_sheet["totalStockholdersEquity"]),

    # Current Liabilities
    ("Total Liabilities",                    "Total Current Liabilities",       balance_sheet["totalCurrentLiabilities"]),
    ("Total Current Liabilities",            "Tax Payables",                    balance_sheet["taxPayables"]),
    ("Total Current Liabilities",            "Short-Term Debt",                 balance_sheet["shortTermDebt"]),
    ("Total Current Liabilities",            "Capital Lease Obligations (Current)", balance_sheet["capitalLeaseObligationsCurrent"]),
    ("Total Current Liabilities",            "Deferred Revenue (Current)",      balance_sheet["deferredRevenue"]),
    ("Total Current Liabilities",            "Other Current Liabilities",       balance_sheet["otherCurrentLiabilities"]),
    ("Total Current Liabilities",            "Accounts Payable",                balance_sheet["accountPayables"]),
    ("Total Current Liabilities",            "Other Payables",                  balance_sheet["otherPayables"]),
    ("Total Current Liabilities",            "Accrued Expenses",                balance_sheet["accruedExpenses"]),

    # Non-Current Liabilities
    ("Total Liabilities",                    "Total Non-Current Liabilities",   balance_sheet["totalNonCurrentLiabilities"]),
    ("Total Non-Current Liabilities",        "Long-Term Debt",                  balance_sheet["longTermDebt"]),
    ("Total Non-Current Liabilities",        "Capital Lease Obligations (Non-Current)", balance_sheet["capitalLeaseObligationsNonCurrent"]),
    ("Total Non-Current Liabilities",        "Deferred Revenue (Non-Current)",  balance_sheet["deferredRevenueNonCurrent"]),
    ("Total Non-Current Liabilities",        "Deferred Tax Liabilities (Non-Current)", balance_sheet["deferredTaxLiabilitiesNonCurrent"]),
    ("Total Non-Current Liabilities",        "Other Non-Current Liabilities",   balance_sheet["otherNonCurrentLiabilities"]),

    # Equity
    ("Total Stockholders' Equity",           "Common Stock",                    balance_sheet["commonStock"]),
    ("Total Stockholders' Equity",           "Retained Earnings",               balance_sheet["retainedEarnings"]),
    ("Total Stockholders' Equity",           "Accumulated Other Comprehensive Income (Loss)", balance_sheet["accumulatedOtherComprehensiveIncomeLoss"]),
    ("Total Stockholders' Equity",           "Additional Paid-In Capital",      balance_sheet["additionalPaidInCapital"]),
    ("Total Stockholders' Equity",           "Other Stockholders' Equity",      balance_sheet["otherTotalStockholdersEquity"]),
]
Next, we make some adjustments to the flows where the numbers are negative. For negative numbers we reverse the flow and make the color red, we will use an example to highlight why we need to do this later.
# need to adjust flow to make negative values easier to read
adjusted_flows = []
for src, tgt, val in flows:
    if val >= 0:
        # positive: keep direction, color green
        adjusted_flows.append((src, tgt, val, 'rgba(50,200,50,0.6)'))
    else:
        # negative: reverse direction, color red
        adjusted_flows.append((tgt, src, -val, 'rgba(200,50,50,0.6)'))
Label the Nodes in the Diagram
If you recall earlier, every node in the diagram is labelled by the line item name in the financial statement, followed by its respective dollar amount in brackets.
We will now map the human readable names of the line items with their respective dollar values for labelling the nodes.
# for labelling later, first we store the source and target names
labels = []
for src, tgt, _ in flows:
    if src not in labels: labels.append(src)
    if tgt not in labels: labels.append(tgt)

# map label to its actual balance‐sheet value for annotation
node_values = {
    "Cash and Cash Equivalents":                         balance_sheet["cashAndCashEquivalents"],
    "Short-Term Investments":                            balance_sheet["shortTermInvestments"],
    "Net Receivables":                                   balance_sheet["netReceivables"],
    "Inventory":                                         balance_sheet["inventory"],
    "Prepaids":                                          balance_sheet["prepaids"],
    "Other Current Assets":                              balance_sheet["otherCurrentAssets"],
    "Total Current Assets":                              balance_sheet["totalCurrentAssets"],
    "Property, Plant and Equipment, Net":                balance_sheet["propertyPlantEquipmentNet"],
    "Goodwill":                                          balance_sheet["goodwill"],
    "Intangible Assets":                                 balance_sheet["intangibleAssets"],
    "Long-Term Investments":                             balance_sheet["longTermInvestments"],
    "Tax Assets":                                        balance_sheet["taxAssets"],
    "Other Non-Current Assets":                          balance_sheet["otherNonCurrentAssets"],
    "Total Non-Current Assets":                          balance_sheet["totalNonCurrentAssets"],
    "Total Assets":                                      balance_sheet["totalAssets"],

    "Total Liabilities":                                 balance_sheet["totalLiabilities"],
    "Total Current Liabilities":                         balance_sheet["totalCurrentLiabilities"],
    "Tax Payables":                                      balance_sheet["taxPayables"],
    "Short-Term Debt":                                   balance_sheet["shortTermDebt"],
    "Capital Lease Obligations (Current)":               balance_sheet["capitalLeaseObligationsCurrent"],
    "Deferred Revenue (Current)":                        balance_sheet["deferredRevenue"],
    "Other Current Liabilities":                         balance_sheet["otherCurrentLiabilities"],

    "Accounts Payable":                                  balance_sheet["accountPayables"],
    "Other Payables":                                    balance_sheet["otherPayables"],
    "Accrued Expenses":                                  balance_sheet["accruedExpenses"],

    "Total Non-Current Liabilities":                     balance_sheet["totalNonCurrentLiabilities"],
    "Long-Term Debt":                                    balance_sheet["longTermDebt"],
    "Capital Lease Obligations (Non-Current)":           balance_sheet["capitalLeaseObligationsNonCurrent"],
    "Deferred Revenue (Non-Current)":                    balance_sheet["deferredRevenueNonCurrent"],
    "Deferred Tax Liabilities (Non-Current)":            balance_sheet["deferredTaxLiabilitiesNonCurrent"],
    "Other Non-Current Liabilities":                     balance_sheet["otherNonCurrentLiabilities"],

    "Total Stockholders' Equity":                        balance_sheet["totalStockholdersEquity"],
    "Common Stock":                                      balance_sheet["commonStock"],
    "Retained Earnings":                                 balance_sheet["retainedEarnings"],
    "Accumulated Other Comprehensive Income (Loss)":     balance_sheet["accumulatedOtherComprehensiveIncomeLoss"],
    "Additional Paid-In Capital":                        balance_sheet["additionalPaidInCapital"],
    "Other Stockholders' Equity":                        balance_sheet["otherTotalStockholdersEquity"],
}
Next, we write a function to clean up the labels by taking care of the billions, millions and thousands.
# for formatting, annotate labels with $ amounts and take care of billions, millions, thousands
def fmt(val):
    if abs(val) >= 1e9: return f"${val/1e9:.1f}B"
    if abs(val) >= 1e6: return f"${val/1e6:.1f}M"
    if abs(val) >= 1e3: return f"${val/1e3:.0f}K"
    return f"${val:.0f}"
We now create a list of labels that consist of the names of the sources and targets. We then obtain the index value of the sources, targets, values (dollar amounts) and colors and store them in lists. These lists are in the format required by the Plotly library for plotting the Sankey diagram.
# put the source and target values in labels
labels = []
for s, t, _, _ in adjusted_flows:
    if s not in labels: labels.append(s)
    if t not in labels: labels.append(t)

idx = {label:i for i,label in enumerate(labels)}
source = [ idx[s] for s, t, _, _ in adjusted_flows ] # index of sources for sankey input
target = [ idx[t] for s, t, _, _ in adjusted_flows ] # index of target for sankey input
value  = [     v   for _, _, v, _ in adjusted_flows ]
colors = [     c   for _, _, _, c in adjusted_flows ]
Next we create our final list for labelling called label_with_values where we clean the text up a bit (i.e. remove some redundant words and make the negative values more obvious). We also pair the labels with their respective dollar amounts in backets, in the last line of the code below.
label_with_values = []
for label in labels:
    val = node_values[label]
    base = label.replace(" (Current)", "")\
                .replace(" (Non-Current)", "") # saves some printing space
    if val < 0:
        base += " [NEGATIVE]" # just to make negatives more obvious in the label
    label_with_values.append(f"{base} ({fmt(val)})")
Render the Balance Sheet Chart!
We have now defined all the lists of data needed to be passed into the go.Sankey() function in the Plotly library. We need our label_with_values list to label the source and target nodes, and we also need to give the source, target, value, and colors lists for the function to draw the links with the correct thickness, label and color.
# sankey diagram!
fig = go.Figure(go.Sankey(
    arrangement="snap",
    node = dict(label=label_with_values, pad=15, thickness=20),
    link = dict(source=source, target=target, value=value, color=colors)
))

fig.update_layout(
    title_text=f"Annual Balance Sheet — {symbol}",
    font_size=10,
    height=800
)
fig.show()
The result is shown below (click to enlarge). Hopefully this helps you to see the constituents of AMZN’s assets as well as how they are funded, and connect the dots of all the line items together.
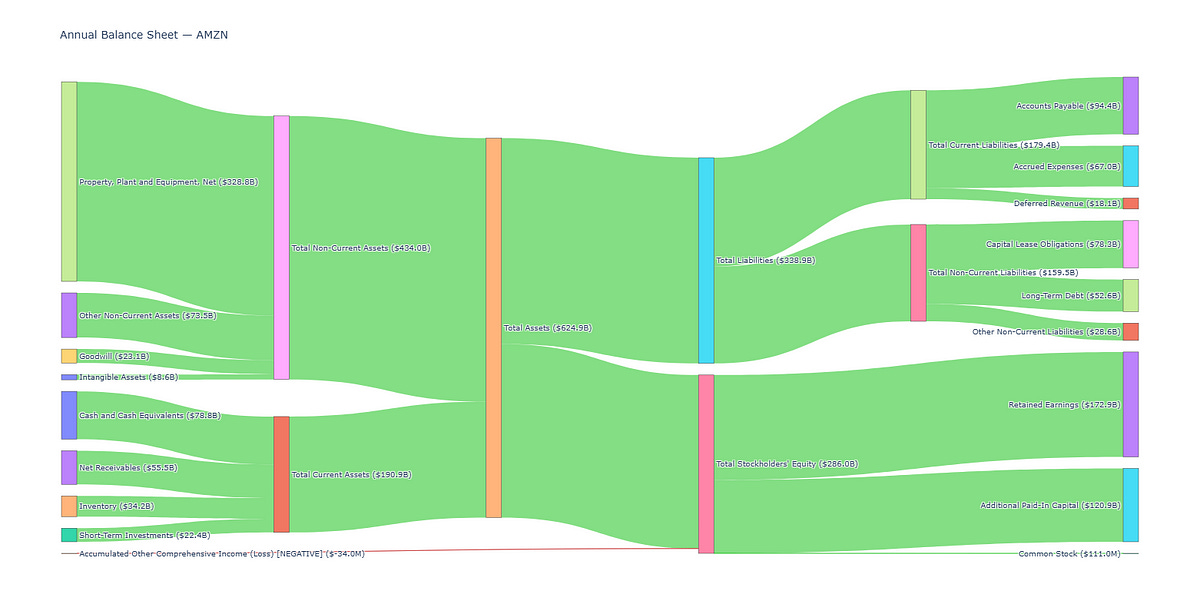
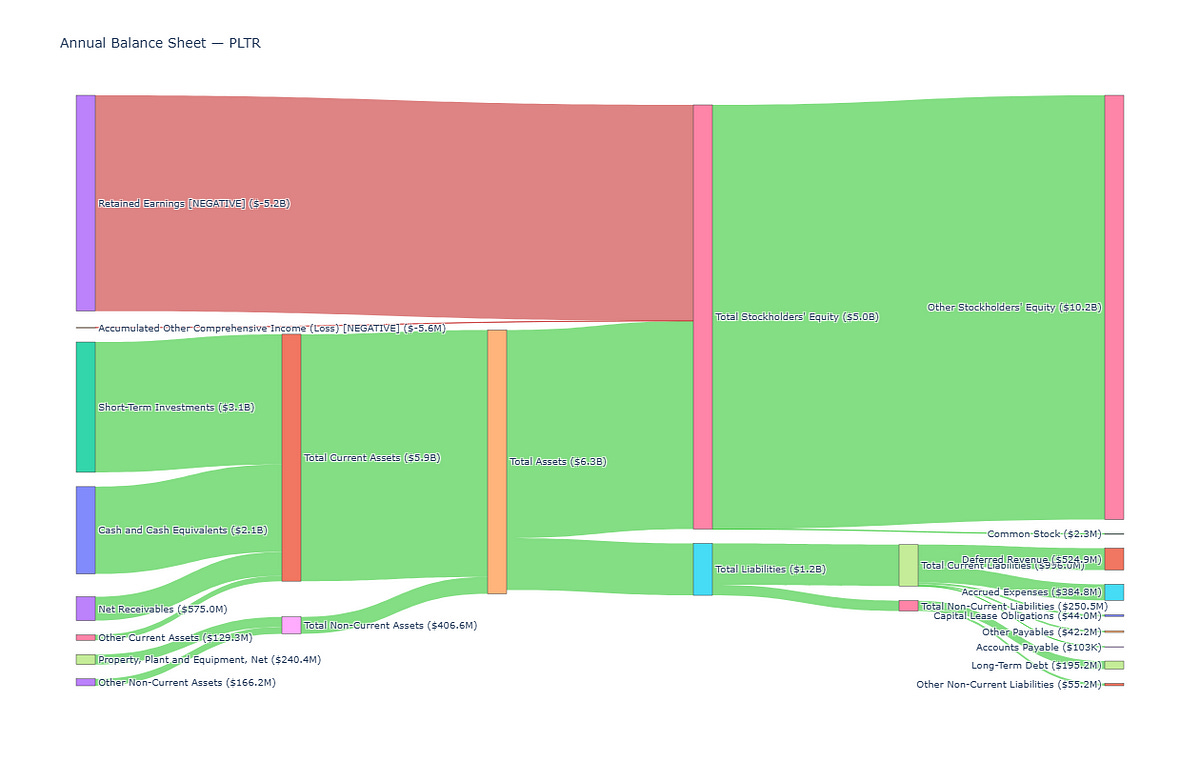
If you recalled earlier, we reversed the flow of negative values and color them red.
Let’s look at a case where this is necessary, highlighted in Palantir’s (PLTR) balance sheet below. Unlike AMZN, the retained earnings is a large NEGATIVE value below.
This is because early stage growth companies can often invest heavily in R&D, marketing, and customer acquisition. They may be unprofitable yet, or have recently just become profitable, such that instead of having the retained earnings add to the stockholder’s equity to fund the assets, their contribution to the balance sheet is negative. We color negative values red to make it obvious as shown below.
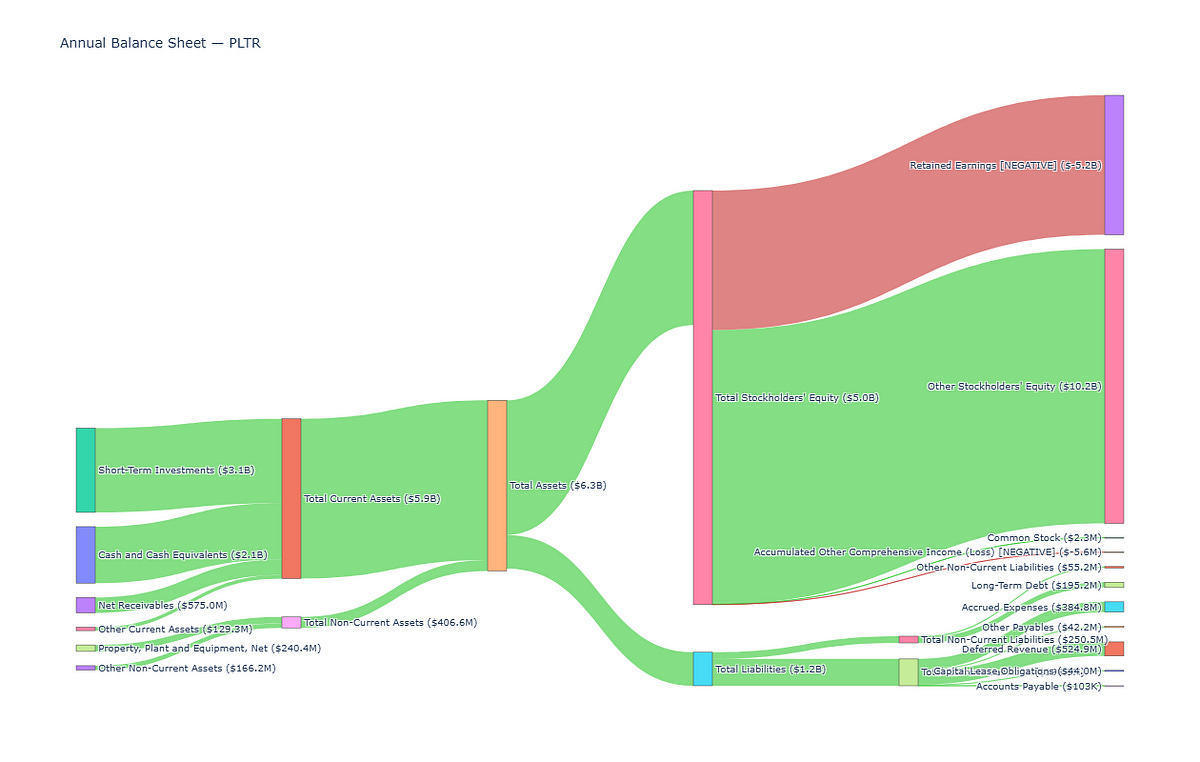
We also reverse the flow for negative values, if we didn’t, the chart would have looked something like this. The stockholder equity would not add up because of the negative retained earnings.
Income Statement Visualization
Let’s now perform the same steps to visualize the income statement.
This time we break the Revenue, Gross Profit, Operating Expenses, and Pretax Income into their underlying components.
I’ve left some code below commented out, and have included why in the comments.
For example “General & Administrative Expenses” and “Selling & Marketing Expenses” are already in “SG&A Expenses” so the first two are commented out. However, in case, for any reason, “SG&A Expenses” is not returned in the API, you can choose to uncomment the first two line items.
flows = [
# Revenue─
("Revenue", "Cost of Revenue", income_statement["costOfRevenue"]),
("Revenue", "Gross Profit", income_statement["grossProfit"]),
# Gross Profit
("Gross Profit", "Operating Income", income_statement["operatingIncome"]),
("Gross Profit", "Operating Expenses", income_statement["operatingExpenses"]),
# Operating Expenses
("Operating Expenses", "Research & Development Expenses", income_statement["researchAndDevelopmentExpenses"]),
# ("Operating Expenses", "General & Administrative Expenses", income_statement["generalAndAdministrativeExpenses"]), # already in SG&A
# ("Operating Expenses", "Selling & Marketing Expenses", income_statement["sellingAndMarketingExpenses"]), # already in SG&A
("Operating Expenses", "SG&A Expenses", income_statement["sellingGeneralAndAdministrativeExpenses"]),
("Operating Expenses", "Other Operating Expenses", income_statement["otherExpenses"]),
# Pretax Income
("Pretax Income", "Income Tax Expense", income_statement["incomeTaxExpense"]),
("Pretax Income", "Net Income", income_statement["netIncome"]),
("Pretax Income", "Interest Expense", income_statement["interestExpense"]),
# this value is recorded as negative in API, but we do not need to reverse the flow like in balance sheet
# because it decreases the pretax income so we put it together at the same side with all the tax expenses
("Pretax Income", "Non-Operating Income Excl. Interest", -income_statement["nonOperatingIncomeExcludingInterest"]),
("Pretax Income", "Total Other Income & Expenses Net", income_statement["totalOtherIncomeExpensesNet"]),
("Pretax Income", "Other Adjustments to Net Income", income_statement["otherAdjustmentsToNetIncome"]),
# Other Income that goes into Pretax Income
("Operating Income", "Pretax Income", income_statement["operatingIncome"]),
("Net Interest Income", "Pretax Income", income_statement["netInterestIncome"]),
("Interest Income", "Pretax Income", income_statement["interestIncome"]),
]
# need to adjust flow to make negative values easier to read
adjusted_flows = []
for src, tgt, val in flows:
if val >= 0:
# positive: keep direction, color green
adjusted_flows.append((src, tgt, val, 'rgba(50,200,50,0.6)'))
else:
# negative: reverse direction, color red
adjusted_flows.append((tgt, src, -val, 'rgba(200,50,50,0.6)'))
# for labelling later, first we store the source and target names
labels = []
for src, tgt, _ in flows:
if src not in labels: labels.append(src)
if tgt not in labels: labels.append(tgt)
# map label to its actual balance‐sheet value for annotation
node_values = {
"Revenue": income_statement["revenue"],
"Cost of Revenue": income_statement["costOfRevenue"],
"Gross Profit": income_statement["grossProfit"],
"Operating Income": income_statement["operatingIncome"],
"Operating Expenses": income_statement["operatingExpenses"],
"Research & Development Expenses": income_statement["researchAndDevelopmentExpenses"],
#"General & Administrative Expenses": income_statement["generalAndAdministrativeExpenses"], # already in SG&A
#"Selling & Marketing Expenses": income_statement["sellingAndMarketingExpenses"], # already in SG&A
"SG&A Expenses": income_statement["sellingGeneralAndAdministrativeExpenses"],
"Other Operating Expenses": income_statement["otherExpenses"],
"Net Interest Income": income_statement["netInterestIncome"],
"Interest Income": income_statement["interestIncome"],
"Interest Expense": income_statement["interestExpense"],
"Non-Operating Income Excl. Interest":-income_statement["nonOperatingIncomeExcludingInterest"],
"Total Other Income & Expenses Net": income_statement["totalOtherIncomeExpensesNet"],
"Pretax Income": income_statement["incomeBeforeTax"],
"Income Tax Expense": income_statement["incomeTaxExpense"],
"Net Income": income_statement["netIncome"],
"Other Adjustments to Net Income": income_statement["otherAdjustmentsToNetIncome"],
"Bottom Line Net Income": income_statement["bottomLineNetIncome"],
}
# for formatting, annotate labels with $ amounts and take care of billions, millions, thousands
def fmt(val):
if abs(val) >= 1e9: return f"${val/1e9:.1f}B"
if abs(val) >= 1e6: return f"${val/1e6:.1f}M"
if abs(val) >= 1e3: return f"${val/1e3:.0f}K"
return f"${val:.0f}"
# put the sorce and target values in labels
labels = []
for s, t, _, _ in adjusted_flows:
if s not in labels: labels.append(s)
if t not in labels: labels.append(t)
idx = {label:i for i,label in enumerate(labels)}
source = [ idx[s] for s, t, _, _ in adjusted_flows ] # index of sources for sankey input
target = [ idx[t] for s, t, _, _ in adjusted_flows ] # index of target for sankey input
value = [ v for _, _, v, _ in adjusted_flows ]
colors = [ c for _, _, _, c in adjusted_flows ]
label_with_values = []
for label in labels:
val = node_values[label]
base = label.replace(" (Current)", "")\
.replace(" (Non-Current)", "") # saves some printing space
if val < 0:
base += " [NEGATIVE]" # just to make negatives more obvious in the label
label_with_values.append(f"{base} ({fmt(val)})")
# sankey diagram!
fig = go.Figure(go.Sankey(
arrangement="snap",
node = dict(label=label_with_values, pad=15, thickness=20),
link = dict(source=source, target=target, value=value, color=colors)
))
fig.update_layout(
title_text=f"Annual Income Statement — {symbol}",
font_size=10,
height=600
)
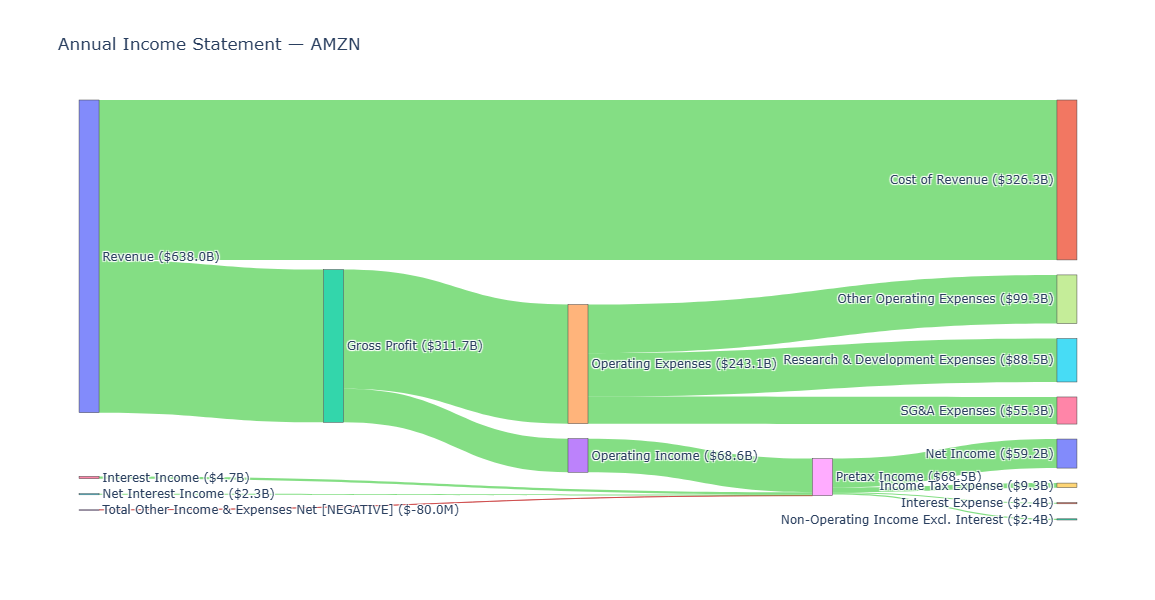
fig.show()The result is shown below. Hopefully this helps you to see how profitable a company is and where all its expenses are coming from.
Cash Flow Statement Visualization
Let’s now perform the same steps to visualize the cash flow statement.
This time we look at the (mostly) Inflow of cash from Operating Activities, as well as the Outflow of cash from Investing and Financing Activities.
Again I’ve left some code below commented out because some of the line items may overlap.
flows = [
    # Operating Activities (Inflow)
    ("Net Income",                             "Operating Activities",                 cash_flow["netIncome"]),
    ("Depreciation & Amortization",            "Operating Activities",                 cash_flow["depreciationAndAmortization"]),
    ("Deferred Income Tax",                    "Operating Activities",                 cash_flow["deferredIncomeTax"]),
    ("Stock-Based Compensation",               "Operating Activities",                 cash_flow["stockBasedCompensation"]),
    ("Change in Working Capital",              "Operating Activities",                 cash_flow["changeInWorkingCapital"]),
    ("Accounts Receivables Δ",                 "Operating Activities",                 cash_flow["accountsReceivables"]),
    ("Inventory Δ",                            "Operating Activities",                 cash_flow["inventory"]),
    ("Accounts Payable Δ",                     "Operating Activities",                 cash_flow["accountsPayables"]),
    #("Other Working Capital Δ",                "Operating Activities",                 cash_flow["otherWorkingCapital"]), # overlap with some lines
    ("Other Non-Cash Items",                   "Operating Activities",                 cash_flow["otherNonCashItems"]),
    ("Operating Activities",                   "Net Cash Inflow (Operating)",       cash_flow["netCashProvidedByOperatingActivities"]),

    # Investing Activities (Outflow)
    ("Investments in PP&E",                    "Investing Activities",                 cash_flow["investmentsInPropertyPlantAndEquipment"]),
    ("Acquisitions, Net",                      "Investing Activities",                 cash_flow["acquisitionsNet"]),
    ("Purchases of Investments",               "Investing Activities",                 cash_flow["purchasesOfInvestments"]),
    ("Sales/Maturities of Investments",        "Investing Activities",                 cash_flow["salesMaturitiesOfInvestments"]),
    ("Other Investing Activities",             "Investing Activities",                 cash_flow["otherInvestingActivities"]),
    ("Investing Activities",                   "Net Cash Outflow (Investing)",       cash_flow["netCashProvidedByInvestingActivities"]),

    # Financing Activities (Outflow)
    ("Net Debt Issuance",                      "Financing Activities",                 cash_flow["netDebtIssuance"]),
    #("Long-Term Net Debt Issuance",            "Financing Activities",                 cash_flow["longTermNetDebtIssuance"]), # already under net debt
    #("Short-Term Net Debt Issuance",           "Financing Activities",                 cash_flow["shortTermNetDebtIssuance"]), # already under net debt
    #("Net Stock Issuance",                     "Financing Activities",                 cash_flow["netStockIssuance"]),
    ("Net Common Stock Issuance",              "Financing Activities",                 cash_flow["netCommonStockIssuance"]),
    #("Common Stock Issuance",                  "Financing Activities",                 cash_flow["commonStockIssuance"]), # already under net common stock issuance
    #("Common Stock Repurchased",               "Financing Activities",                 cash_flow["commonStockRepurchased"]), # already under net common stock issuance
    ("Net Preferred Stock Issuance",           "Financing Activities",                 cash_flow["netPreferredStockIssuance"]),
    ("Net Dividends Paid",                     "Financing Activities",                 cash_flow["netDividendsPaid"]),
    #("Common Dividends Paid",                  "Financing Activities",                 cash_flow["commonDividendsPaid"]),  # already under net dividends paid
    #("Preferred Dividends Paid",               "Financing Activities",                 cash_flow["preferredDividendsPaid"]), # already under net dividends paid
    ("Other Financing Activities",             "Financing Activities",                 cash_flow["otherFinancingActivities"]),
    ("Financing Activities",                   "Net Cash Outflow (Financing)",       cash_flow["netCashProvidedByFinancingActivities"]),

    # Combine In and Out Flows
    ("Net Cash Inflow (Operating)",         "Net Change in Cash",                   cash_flow["netCashProvidedByOperatingActivities"]),
    ("Net Cash Outflow (Investing)",         "Net Change in Cash",                   cash_flow["netCashProvidedByInvestingActivities"]),
    ("Net Cash Outflow (Financing)",         "Net Change in Cash",                   cash_flow["netCashProvidedByFinancingActivities"]),
    ("Effect of Forex on Cash",                "Net Change in Cash",                   cash_flow["effectOfForexChangesOnCash"]),

    # Beginning & Change → Ending Balance
    ("Cash at Beginning of Period",            "Cash at End of Period",                cash_flow["cashAtBeginningOfPeriod"]),
    ("Net Change in Cash",                     "Cash at End of Period",                cash_flow["netChangeInCash"]),
]

adjusted_flows = []
for src, tgt, val in flows:
    if val >= 0:
        adjusted_flows.append((src, tgt, val, 'rgba(50,200,50,0.6)'))
    else:
        # reverse direction for readability
        adjusted_flows.append((tgt, src, -val,    'rgba(200,50,50,0.6)'))


labels = []
for s, t, _, _ in adjusted_flows:
    if s not in labels: labels.append(s)
    if t not in labels: labels.append(t)

node_values = { lbl: cash_flow[
    {
      "Net Income": "netIncome",
      "Depreciation & Amortization": "depreciationAndAmortization",
      "Deferred Income Tax": "deferredIncomeTax",
      "Stock-Based Compensation": "stockBasedCompensation",
      "Change in Working Capital": "changeInWorkingCapital",
      "Accounts Receivables Δ": "accountsReceivables",
      "Inventory Δ": "inventory",
      "Accounts Payable Δ": "accountsPayables",
      "Other Working Capital Δ": "otherWorkingCapital",
      "Other Non-Cash Items": "otherNonCashItems",
      "Operating Activities": "netCashProvidedByOperatingActivities",
      "Investments in PP&E": "investmentsInPropertyPlantAndEquipment",
      "Acquisitions, Net": "acquisitionsNet",
      "Purchases of Investments": "purchasesOfInvestments",
      "Sales/Maturities of Investments": "salesMaturitiesOfInvestments",
      "Other Investing Activities": "otherInvestingActivities",
      "Investing Activities": "netCashProvidedByInvestingActivities",
      "Net Debt Issuance": "netDebtIssuance",
      "Long-Term Net Debt Issuance": "longTermNetDebtIssuance",
      "Short-Term Net Debt Issuance": "shortTermNetDebtIssuance",
      "Net Stock Issuance": "netStockIssuance",
      "Net Common Stock Issuance": "netCommonStockIssuance",
      "Common Stock Issuance": "commonStockIssuance",
      "Common Stock Repurchased": "commonStockRepurchased",
      "Net Preferred Stock Issuance": "netPreferredStockIssuance",
      "Net Dividends Paid": "netDividendsPaid",
      "Common Dividends Paid": "commonDividendsPaid",
      "Preferred Dividends Paid": "preferredDividendsPaid",
      "Other Financing Activities": "otherFinancingActivities",
      "Financing Activities": "netCashProvidedByFinancingActivities",
      "Net Cash Inflow (Operating)": "netCashProvidedByOperatingActivities",
      "Net Cash Outflow (Investing)": "netCashProvidedByInvestingActivities",
      "Net Cash Outflow (Financing)": "netCashProvidedByFinancingActivities",
      "Effect of Forex on Cash": "effectOfForexChangesOnCash",
      "Net Change in Cash": "netChangeInCash",
      "Cash at Beginning of Period": "cashAtBeginningOfPeriod",
      "Cash at End of Period": "cashAtEndOfPeriod",
    }[lbl]
] for lbl in labels }


def fmt(val):
    if abs(val) >= 1e9: return f"${val/1e9:.1f}B"
    if abs(val) >= 1e6: return f"${val/1e6:.1f}M"
    if abs(val) >= 1e3: return f"${val/1e3:.0f}K"
    return f"${val:.0f}"


idx     = { lbl:i for i,lbl in enumerate(labels) }
source  = [ idx[s] for s, t, _, _ in adjusted_flows ]
target  = [ idx[t] for s, t, _, _ in adjusted_flows ]
value   = [     v   for _, _, v, _ in adjusted_flows ]
colors  = [     c   for _, _, _, c in adjusted_flows ]

label_with_values = []
for lbl in labels:
    val  = node_values[lbl]
    base = lbl
    if val < 0: base += " [NEGATIVE]"
    label_with_values.append(f"{base} ({fmt(val)})")


fig = go.Figure(go.Sankey(
    arrangement="snap",
    node = dict(label=label_with_values, pad=15, thickness=20),
    link = dict(source=source, target=target, value=value, color=colors)
))

fig.update_layout(
    title_text=f"Annual Cash-Flow Statement - {symbol}",
    font_size=10,
    height=900
)
fig.show()
The result is shown below. Hopefully this helps you to see the proportion of each of the activities resulting in both the cash inflows and outflows, and how this results in the Net Change in Cash from the Cash at Beginning of Period to the Cash at End of Period.
There we go, all 3 financial statements plotted in Python!
Did you mentally visualize financial statements in the same way before? Were you caught by surprise for any of them? (e.g. Did you think most of the net income of AMZN flows into its Cash at End of Period, or did you already know most of this cash goes into financing other things?)
Of course, we already have plenty of financial ratios to compare the magnitude of the line items without having to visualize them. But hopefully the Sankey diagrams help to tie everything together in a comprehensive manner for you!
Python Code and Streamlit App
👉 GET THE PYTHON NOTEBOOK for the full analysis in this post here.I’ve also made an accompanying Streamlit app and deployed it. In this app, you can enter any stock ticker of your choice to plot out the financial statements. The code for this app is also in the link above.
👉 Try out the accompanying Streamlit app that I have deployed here.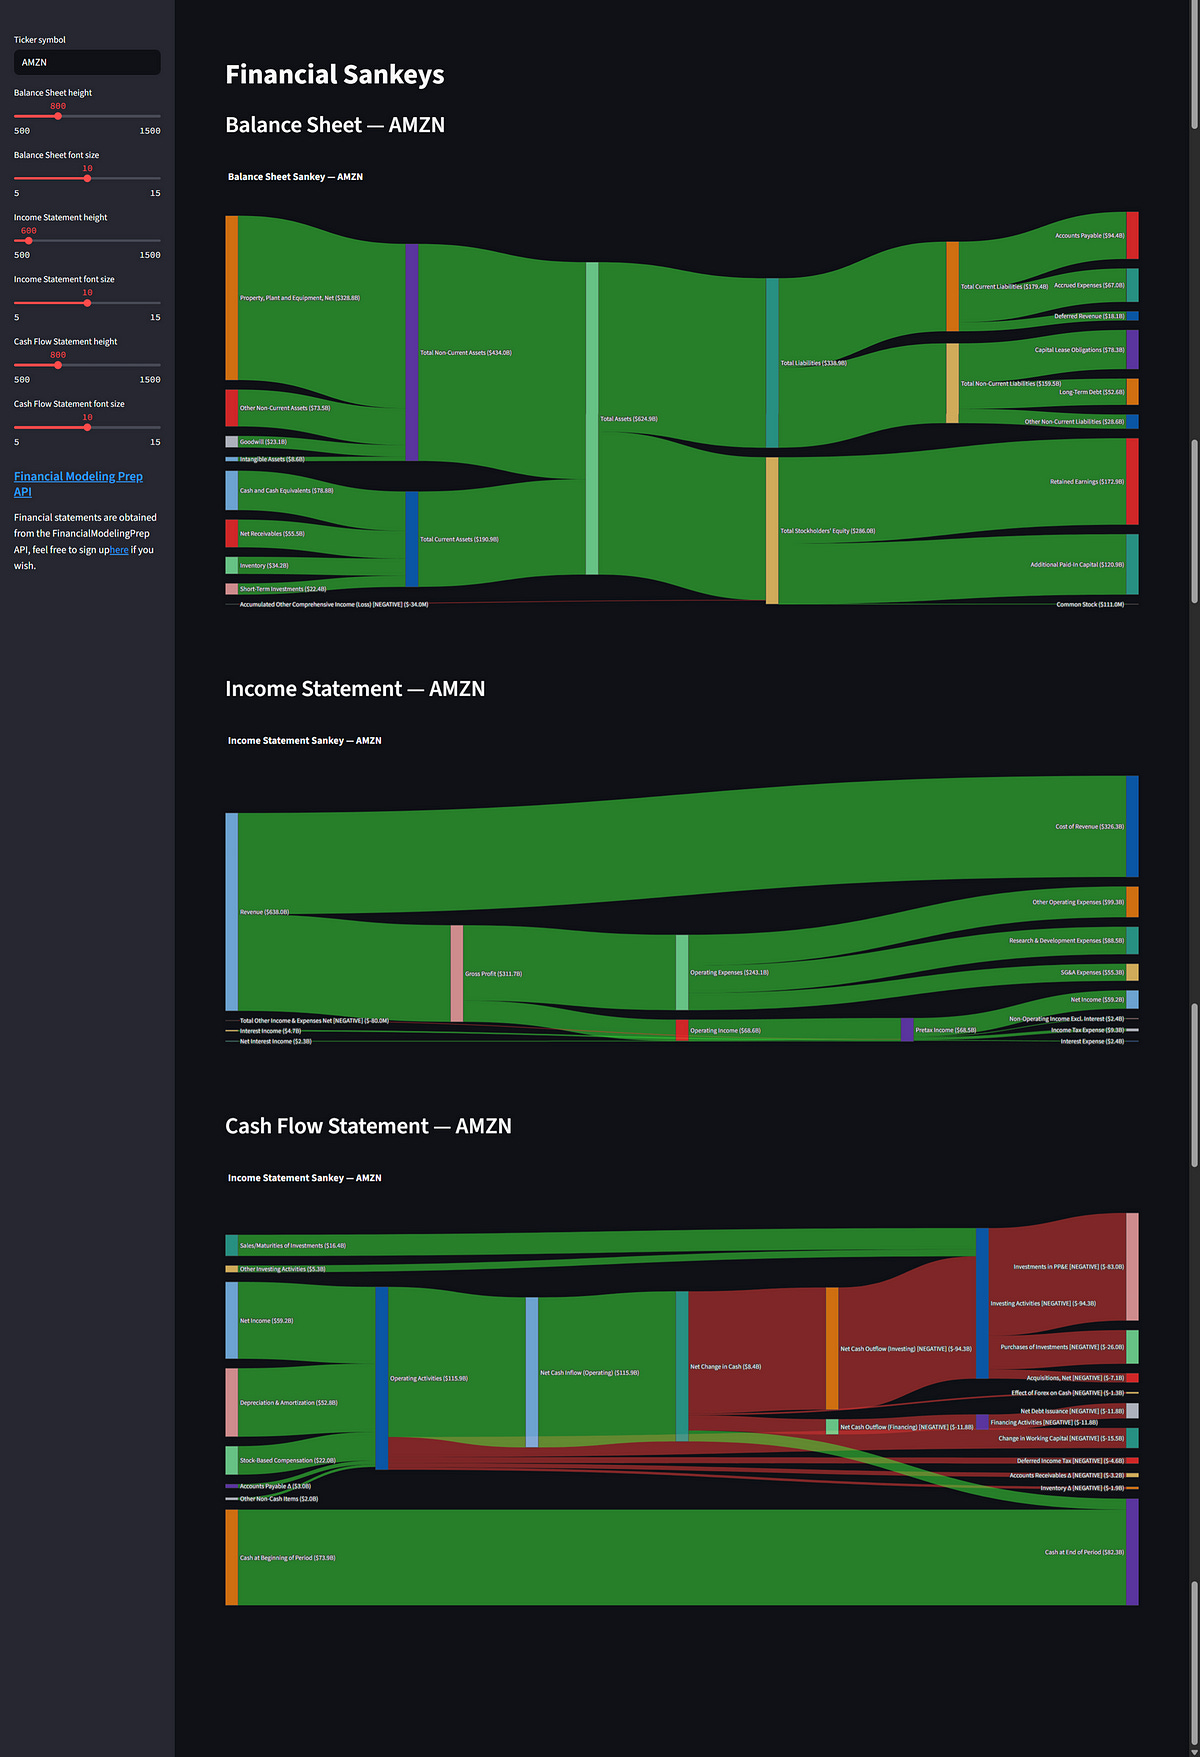
If you liked this post, subscribe below if you haven’t, so you won’t miss any future posts!
Cheers,
Damian
Code Meets Capital